Last updated: May 2026
41 sourced data points on revenue, arrivals, Northern Circuit parks, Zanzibar, migration timing, and Kilimanjaro access
Tourism earned $4.2 billion in the year ending October 2025 (Bank of Tanzania, Monthly Economic Review October 2025). That headline sits beside three larger signals: tourism contributes 17.2% of GDP, generates roughly 25% of export earnings, and supports about 1.5 million jobs (Tanzania Government/UN Tourism, Tourism Performance Update 2024). This article aggregates the strongest available data from the Bank of Tanzania, Grand View Research, UN Tourism/government reporting, TANAPA, NCAA, and the National Bureau of Statistics. The result is a source-led snapshot of where Tanzania safari demand is growing, which parks are carrying the volume, and how travelers should think about 2026 planning.
Introduction
Tourism earned $4.2 billion in the year ending October 2025 (Bank of Tanzania, Monthly Economic Review October 2025). Tanzania is no longer only recovering from the pandemic cycle; it is expanding through stronger park demand, regional arrivals, new infrastructure, and safari-and-sea itineraries. The safari market alone is valued at $2.78 billion in 2025 and projected to reach $5.28 billion by 2033 (Grand View Research, Safari Tourism Market Report 2026). This article brings together data from Bank of Tanzania, Grand View Research, UN Tourism, TANAPA, NCAA, and the National Bureau of Statistics to give travelers and operators a clean 2026 benchmark.
Key Takeaways
- Tourism revenue reached $4.2 billion for the year ending October 2025 (Bank of Tanzania, Monthly Economic Review October 2025).
- Tourism contributes 17.2% of GDP (Tanzania Government/UN Tourism, Tourism Performance Update 2024).
- The safari market is projected to grow at an 8.7% CAGR from 2025 to 2033 (Grand View Research, Safari Tourism Market Report 2026).
- Ngorongoro recorded 1,061,620 visitors in 2024/25 (NCAA/The Citizen, Ngorongoro Tourism Investment Update 2026).
- Serengeti had 491,000 visitors recorded by the second week of December 2025 in the 2025/26 season (TANAPA, Tourism Splash Issue No. 2 2026).
- Kenya was Tanzania’s #1 source market from January to May 2025 (National Bureau of Statistics, High Frequency Tourism Data 2025).
- Southern Serengeti was expected to see about 500,000 wildebeest calves around February 2026 (TANAPA, Tourism Splash Issue No. 2 2026).
- Low-season safari travel can reduce trip costs by 20-30%, based on operator pricing patterns observed across Tanzanian tour operators. This is an industry estimate, not a formally published statistic. (Industry estimate \u2014 operator pricing patterns).
- Zanzibar ranked as the 2nd-best island destination globally in the Island Index 2024 (Bounce Island Index 2024).
- Tourism supports about 1.5 million jobs across Tanzania’s travel value chain (Tanzania Government/UN Tourism, Tourism Performance Update 2024).
1. Tanzania Tourism Revenue Hits $4.2 Billion – A Record Year
The $4.2 billion tourism-revenue figure matters because it shows travel has become a macroeconomic pillar, not a niche leisure category (Bank of Tanzania, Monthly Economic Review October 2025). Safari demand is now linked to foreign exchange, jobs, transport, hotels, community supply chains, and conservation budgets. The revenue story also explains why Tanzania is investing in access, accommodation, and destination marketing: higher visitor volume only becomes durable value if the experience remains well managed.
| Metric | Value | Source |
|---|---|---|
| Tourism revenue, year ending October 2025 | $4.2 billion | Bank of Tanzania, Monthly Economic Review October 2025 |
| Tourism share of GDP | 17.2% | Tanzania Government/UN Tourism, Tourism Performance Update 2024 |
| Tourism share of export earnings | 25% | Tanzania Government/UN Tourism, Tourism Performance Update 2024 |
| Jobs supported by tourism | 1.5 million | Tanzania Government/UN Tourism, Tourism Performance Update 2024 |
| Tourist-arrival growth ranking | 6th globally, 1st in Africa | Tanzania Government/UN Tourism, Tourism Performance Update 2024 |
| Safari market size, 2025 | $2.78 billion | Grand View Research, Safari Tourism Market Report 2026 |
| Projected safari market size, 2033 | $5.28 billion | Grand View Research, Safari Tourism Market Report 2026 |
| Projected safari market CAGR, 2025-2033 | 8.7% | Grand View Research, Safari Tourism Market Report 2026 |
The official macro picture is strong, but it should be read carefully. GDP and export-share figures describe tourism’s broad national role, while market forecasts describe the safari category. They are related, but they do not measure the same thing.
2. Northern Circuit Parks by the Numbers: Serengeti, Ngorongoro & Tarangire
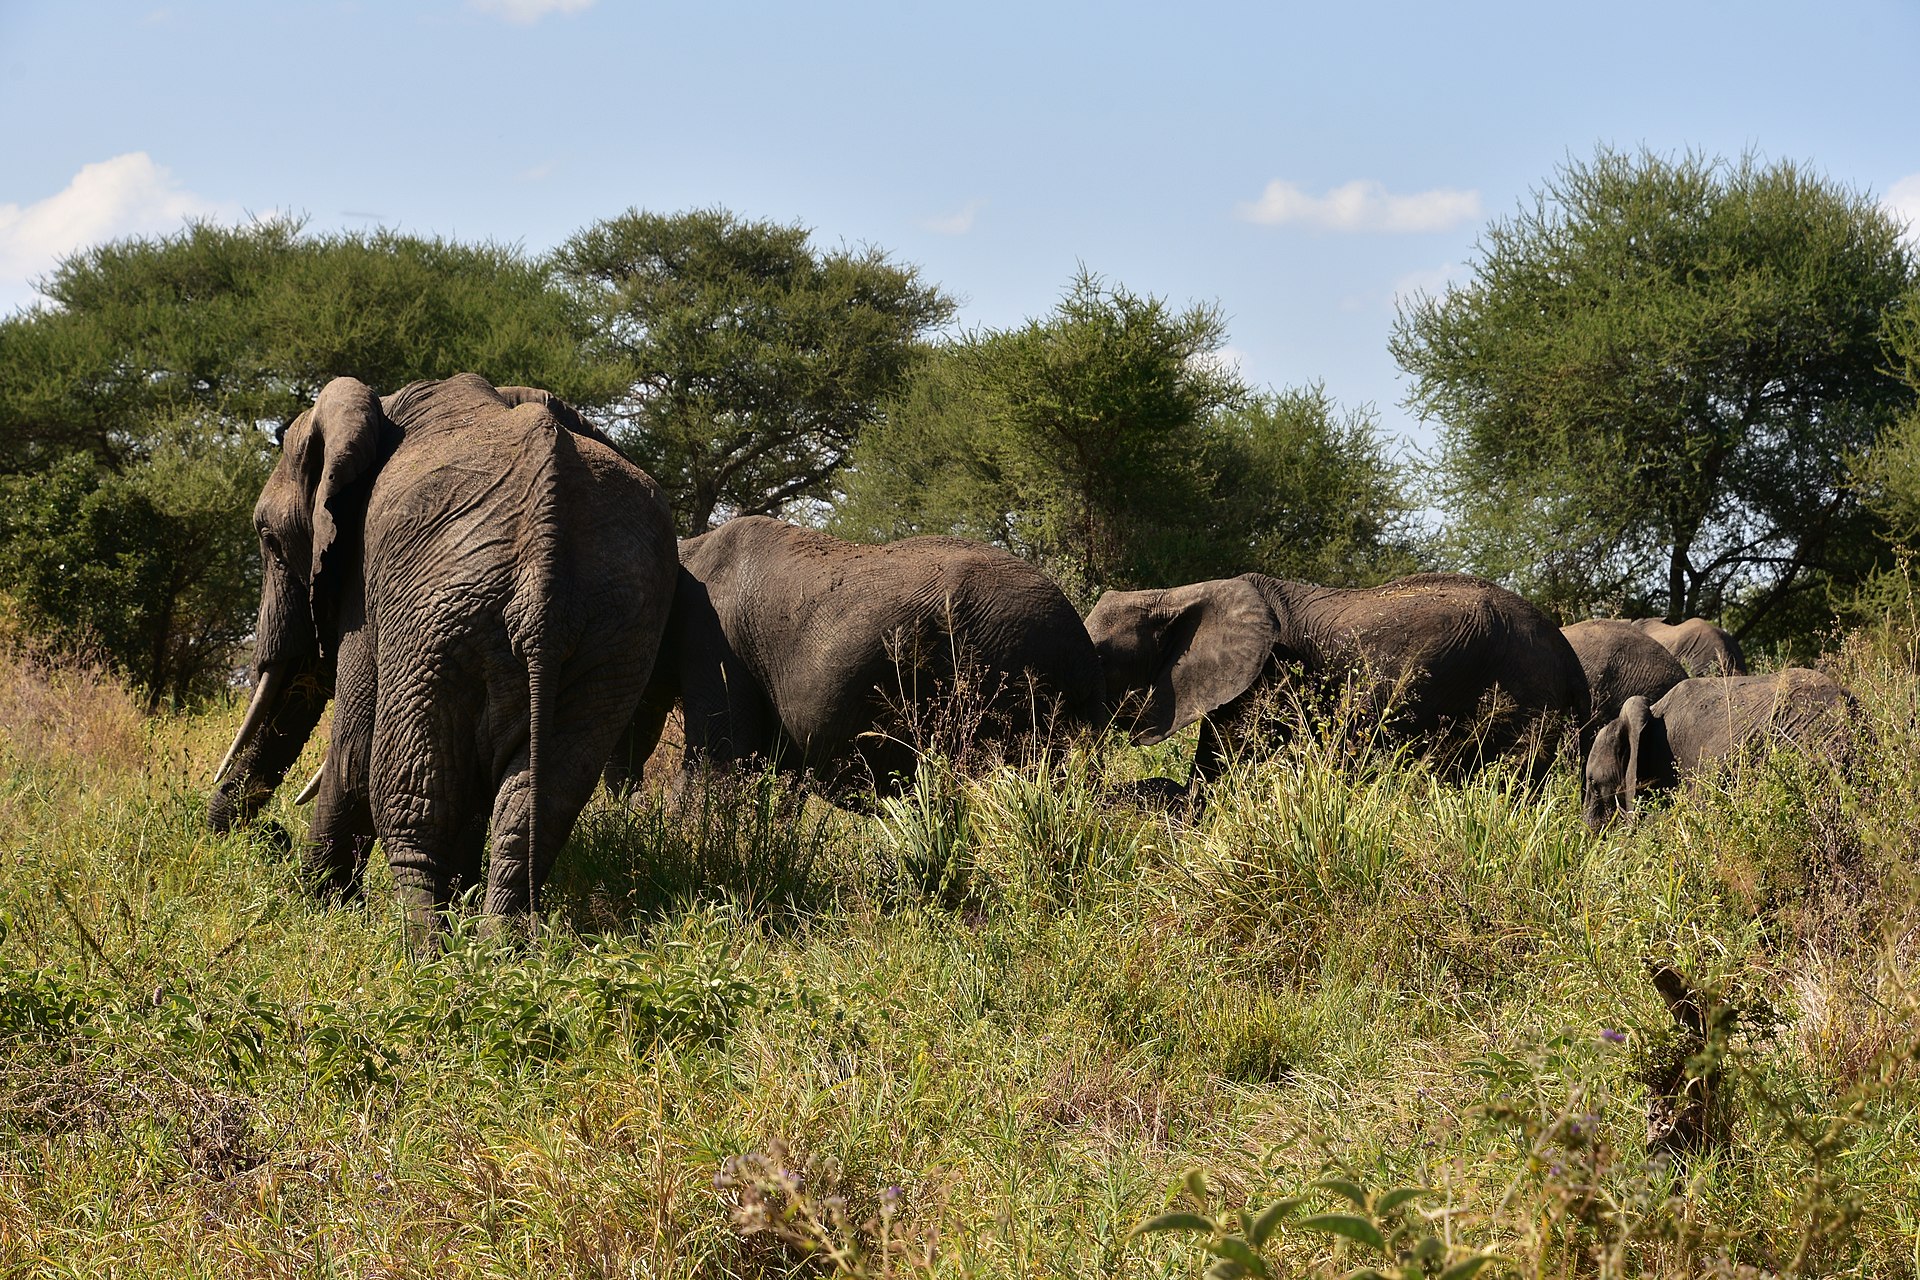
Ngorongoro’s 1,061,620 visitors in 2024/25 show why the Northern Circuit remains Tanzania’s commercial safari engine (NCAA/The Citizen, Ngorongoro Tourism Investment Update 2026). Demand is concentrated around iconic wildlife, short transfer logic, and the ability to combine crater, plains, elephants, and highland scenery within one itinerary. For travelers comparing routes, Serengeti National Park remains the anchor for migration depth, while Ngorongoro and Tarangire add density, scenery, and shorter-stay value.
For help choosing the right park combination, see our Tanzania safari parks compared guide.
| Metric | Value | Source |
|---|---|---|
| Ngorongoro visitors, 2024/25 | 1,061,620 | NCAA/The Citizen, Ngorongoro Tourism Investment Update 2026 |
| Ngorongoro year-on-year growth | 16.8% | NCAA/The Citizen, Ngorongoro Tourism Investment Update 2026 |
| Serengeti visitors recorded by second week of December 2025 | 491,000 | TANAPA, Tourism Splash Issue No. 2 2026 |
| Tarangire annual visitors | About 370,000 | TANAPA/The Citizen, Mamire Gate Opening 2026 |
| Ngorongoro current bed capacity | 1,555 beds | NCAA/The Citizen, Ngorongoro Tourism Investment Update 2026 |
| Ngorongoro planned bed capacity | More than 2,590 beds | NCAA/The Citizen, Ngorongoro Tourism Investment Update 2026 |
| Lake Manyara primary-source visitor data, 2024-2026 | Unavailable in the reviewed primary sources | Methodology caveat |
Lake Manyara is part of the Northern Circuit, but primary-source visitor data for 2024-2026 was not available in the reviewed source set. That gap is noted here rather than filled with unverified secondary estimates.
3. Where Tanzania’s Tourists Come From – Source Markets in 2025-2026
Kenya led Tanzania Mainland arrivals from January to May 2025 with 93,112 visitors (National Bureau of Statistics, High Frequency Tourism Data 2025). The National Bureau of Statistics tourism portal is the official reference point for Tanzania tourism statistics, while the January-May 2025 high-frequency figures show a clear regional-market shift. Regional markets can include leisure, family, trade, events, and cross-border travel, while long-haul markets still carry high safari and beach-holiday intent. A smarter 2026 strategy separates arrival volume from itinerary value instead of treating every source market as the same type of traveler.
| Metric | Value | Source |
|---|---|---|
| Total Tanzania Mainland arrivals, January-May 2025 | 794,102 | National Bureau of Statistics, High Frequency Tourism Data 2025 |
| Kenya arrivals, January-May 2025 | 93,112, equal to 11.7% of arrivals | National Bureau of Statistics, High Frequency Tourism Data 2025 |
| Burundi arrivals, January-May 2025 | 65,874, equal to 8.3% of arrivals | National Bureau of Statistics, High Frequency Tourism Data 2025 |
| United States arrivals, January-May 2025 | 42,478, equal to 5.3% of arrivals | National Bureau of Statistics, High Frequency Tourism Data 2025 |
| Top European source market in the period | France, 38,255 arrivals, equal to 4.8% | National Bureau of Statistics, High Frequency Tourism Data 2025 |
| January-May 2025 year-on-year change | 3.7% above the same period in 2024 | National Bureau of Statistics, High Frequency Tourism Data 2025 |
4. Conservation, Investment & Infrastructure Growth
NCAA’s Sh350 billion revenue target shows how tourism growth is being tied to conservation finance, accommodation expansion, and major-event readiness (NCAA/The Citizen, Ngorongoro Tourism Investment Update 2026). The important point is not only more beds or more gates. Tanzania is trying to convert demand into smoother access, broader product choice, and better dispersal of visitor pressure. That is essential for a country where the best-known parks also carry the heaviest expectations.
| Metric | Value | Source |
|---|---|---|
| Ngorongoro visitor count, 2024/25 | 1,061,620 | NCAA/The Citizen, Ngorongoro Tourism Investment Update 2026 |
| Ngorongoro bed expansion plan | 1,555 to more than 2,590 beds | NCAA/The Citizen, Ngorongoro Tourism Investment Update 2026 |
| NCAA revenue collected, 2024/25 | Sh269.9 billion | NCAA/The Citizen, Ngorongoro Tourism Investment Update 2026 |
| NCAA revenue target | Sh350 billion | NCAA/The Citizen, Ngorongoro Tourism Investment Update 2026 |
| Mamire Gate, Tarangire | Opened in April 2026 | TANAPA/The Citizen, Mamire Gate Opening 2026 |
| AFCON 2027 readiness | Accommodation and service expansion linked to event preparation | NCAA/The Citizen, Ngorongoro Tourism Investment Update 2026 |
5. Zanzibar & Island Extensions – The Safari-and-Sea Boom
Zanzibar ranked 2nd globally in the Island Index 2024, scoring 9.66 out of 10 (Bounce Island Index 2024). That ranking helps explain why safari-and-sea itineraries are no longer an optional extra for many travelers; they are often the shape of the trip. Serengeti or Ngorongoro provides the wildlife peak, while Zanzibar beach holidays add recovery time, honeymoon appeal, family flexibility, and a softer landing after early-morning game drives.

| Metric | Value | Source |
|---|---|---|
| Zanzibar Island Index rank | 2nd globally | Bounce Island Index 2024 |
| Zanzibar Island Index score | 9.66/10 | Bounce Island Index 2024 |
| Zanzibar island count in the index description | More than 40 islands | Bounce Island Index 2024 |
| Average 3-star hotel price cited by the index | $158.56 per night | Bounce Island Index 2024 |
| Maximum sea temperature noted for Zanzibar | 30 degrees C | Bounce Island Index 2024 |
6. Seasonality & Great Migration Timing – When to Book
About 500,000 wildebeest calves were expected around February 2026 in the southern Serengeti (TANAPA, Tourism Splash Issue No. 2 2026). Seasonality affects two things travelers feel immediately: wildlife rhythm and price. Calving season favors the short-grass plains and predator activity, while river-crossing periods are more unpredictable because they respond to rain, grazing pressure, and herd movement. For budget control, Tanzania safari packages in lower-demand months can carry meaningful savings, but travelers should compare the wildlife goal before chasing price alone.

| Metric | Value | Source |
|---|---|---|
| Southern Serengeti calving timing | February highlighted as the calving month | TANAPA, Tourism Splash Issue No. 2 2026 |
| Expected wildebeest calves, February 2026 | About 500,000 | TANAPA, Tourism Splash Issue No. 2 2026 |
| Great Migration herd scale | More than 1.5 million wildebeest, with zebra and gazelle | TANAPA, Tourism Splash Issue No. 2 2026 |
| Low-season safari savings | 20-30% | (Industry estimate \u2014 operator pricing patterns) |
| River-crossing timing | Seasonal and rainfall-sensitive; no guaranteed crossing date | Methodology caveat |
| Peak booking lead time | Not quantified in the supplied primary-source statistics | Methodology caveat |
Migration data should never be sold as a fixed promise. Calving has a clearer seasonal center, but river crossings depend on weather, grass, and herd movement. The best itineraries use flexible routing and realistic expectations.
7. Kilimanjaro & Northern Gateway Access
Kilimanjaro rises to 5,895 meters, making it Africa’s highest mountain and the world’s highest free-standing mountain (TISEZA, Tourism Sector Overview 2026). For northern Tanzania travel, the mountain is more than a trekking icon; it is part of the same gateway economy that feeds Arusha, Moshi, Tarangire, Ngorongoro, and Serengeti itineraries. Better access points such as the Mamire Gate in Tarangire help spread traffic across the circuit, while Kilimanjaro trekking remains the strongest pre- or post-safari extension for active travelers.
| Metric | Value | Source |
|---|---|---|
| Kilimanjaro elevation | 5,895 meters | TISEZA, Tourism Sector Overview 2026 |
| Kilimanjaro status | Highest free-standing mountain in the world and highest in Africa | TISEZA, Tourism Sector Overview 2026 |
| Kilimanjaro climber numbers, 2024-2026 | Not available in the supplied primary-source brief | Methodology caveat |
| Kilimanjaro route success-rate data | Not available in the supplied primary-source brief | Methodology caveat |
| Northern gateway infrastructure link | Mamire Gate opened in April 2026 to improve Tarangire access | TANAPA/The Citizen, Mamire Gate Opening 2026 |
Kilimanjaro climber-volume and route-success statistics were not included in the supplied primary-source brief. This page will be updated when current TANAPA or government data is available.
Tanzania Safari Statistics at a Glance
The table below condenses the highest-signal statistics across revenue, arrivals, park performance, source markets, island extensions, seasonality, and gateway infrastructure.
Methodology and Sources
This article prioritizes primary sources, official public-sector data, authority communications, and reputable market-research sources. Where a requested data point was not available from the reviewed primary-source set, the article flags the gap instead of substituting an unsupported estimate.
- Bank of Tanzania, Monthly Economic Review October 2025
- Grand View Research, Safari Tourism Market Report 2026
- Tanzania Government/UN Tourism, Tourism Performance Update 2024
- TISEZA, Tourism Sector Overview 2026
- National Bureau of Statistics, High Frequency Tourism Data 2025
- National Bureau of Statistics, High Frequency Tourism Data 2025
- TANAPA, Tourism Splash Issue No. 2 2026
- NCAA/The Citizen, Ngorongoro Tourism Investment Update 2026
- TANAPA/The Citizen, Mamire Gate Opening 2026
- Bounce Island Index 2024
Last updated: May 2026. We update this page quarterly as new data becomes available from TANAPA, NCAA, Bank of Tanzania, and UNWTO.
Lake Manyara caveat: Lake Manyara visitor data was unavailable from primary sources for the 2024-2026 period reviewed for this article.
Safari pricing caveat: Safari pricing varies by operator, season, lodge class, routing, private or group format, park-fee exposure, and itinerary length. The 20-30% low-season savings range is an industry estimate based on operator pricing patterns, not a formally published statistic.
What the numbers mean
How Travelers Should Read Tanzania Safari Statistics
Safari statistics are useful when they help travelers make better timing and route choices. Arrival trends, park demand and Zanzibar travel patterns can affect lodge availability, flight planning and how early a private safari should be arranged.